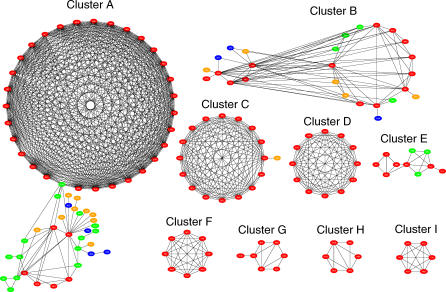
Figure 2. HIV Transmission Clusters Defined by Genetic Distance.
Patients included in major clusters are represented by a red node, and connecting lines between red nodes represent a genetic distance of less than 4.8% (24 differences). Sensitivity of the clusters to the distance criterion shown by additional nodes in green (5.0%), blue (5.2%), and orange (5.4%).

