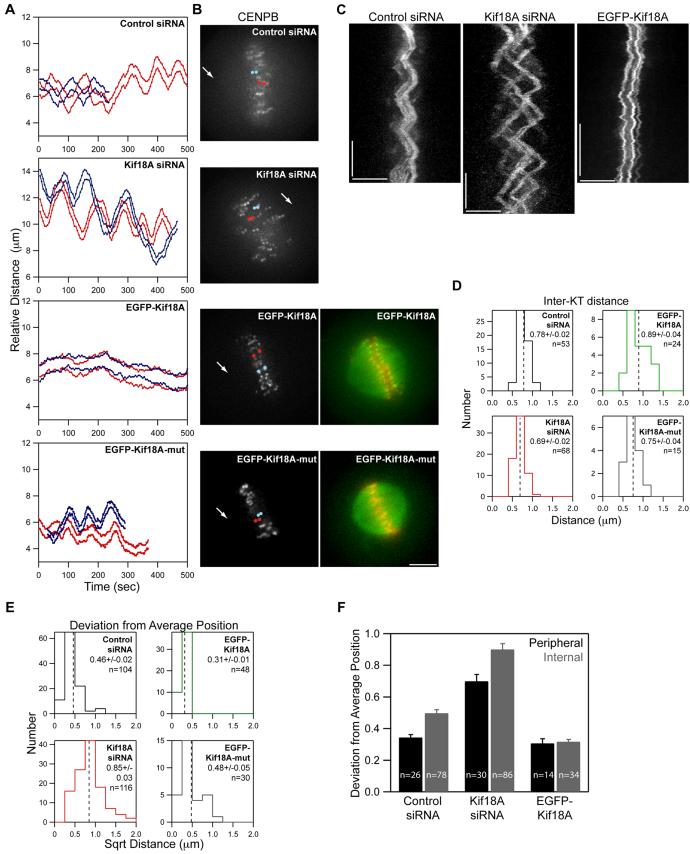
Figure 2. Kif18A affects the oscillatory movements of kinetochores.
(A) Distance versus time plots of two kinetochore pairs (red and blue lines) from each of the indicated cell types. Relative distance was calculated by measuring the separation between each kinetochore and one spindle pole. Images were collected every 5 seconds for control and Kif18A siRNA cells and every 2 seconds for EGFP-Kif18A and EGFP-Kif18A-mut cells.
(B) Still frames of CENP-B fluorescence in cells used to derive the distance versus time plots shown in (A). Arrows indicate position of pole used for relative distance measurements. Red and blue dots are overlayed on kinetochores that were tracked to generate the red and blue traces in (A) respectively. Two-color images of EGFP-Kif18A or EGFP-Kif18A-mut (green) with mRFP-CENP-B (red) were taken immediately after time-lapse imaging of kinetochore movements was stopped. Scale bar is 5 μm.
(C) Representative kymographs of CENP-B fluorescence from cells transfected with control siRNAs, Kif18A-specific siRNAs or EGFP-Kif18A. Vertical scale bars = 2 minutes; horizontal scale bars = 5 μm.
(D) Histograms displaying average inter-kinetochore distances for sister kinetochore pairs in live cells. The mean ± SEM is indicated for each distribution and the mean position is marked by a vertical dotted line. “n” indicates the number kinetochore pairs tracked from 10 (control and Kif18A siRNA), 7 (EGFP-Kif18A) or 4 (EGFP-Kif18A-mut) cells. The average inter-kinetochore distances measured from Kif18A siRNA and EGFP-Kif18A expressing cells are significantly different from those measured in control siRNA treated cells (p = 1.0 × 10⁻⁴ and p = 0.02 respectively). Average inter-kinetochore distances for EGFP-Kif18A expressing cells are also significantly different from EGFP-Kif18A-mut expressing cells (p = 0.02).
(E) Histograms displaying deviation from average position (DAP) calculations for the indicated cell types. The mean ± SEM is given for each distribution and the mean position is marked by a vertical dotted line. “n” indicates the number of kinetochores analyzed from the same data set used in (D). The DAPs for kinetochores in Kif18A-depleted cells and EGFP-Kif18A cells are significantly different from the DAP for kinetochores in control siRNA cells (p = 4.4 × 10⁻²² and 1.2 × 10⁻⁹ respectively). The DAP for EGFP-Kif18A kinetochores is also significantly different from the DAP for EGFP-Kif18A-mut kinetochores (p = 0.002).
(F) Average DAP measurements for kinetochores on the periphery of the spindle (peripheral) and along the pole-to-pole axis (internal) from cells treated with control or Kif18A siRNAs or over-expressing EGFP-Kif18A. Error bars are SEM; “n” indicates the number of kinetochores from the data set used in (E). DAPs for peripheral and internal kinetochores are significantly different in control and Kif18A-depleted cells (p = 5.9 × 10⁻⁷ and p = 7.0 × 10⁻⁴ respectively) but not in EGFP-Kif18A cells (p = 0.75).

