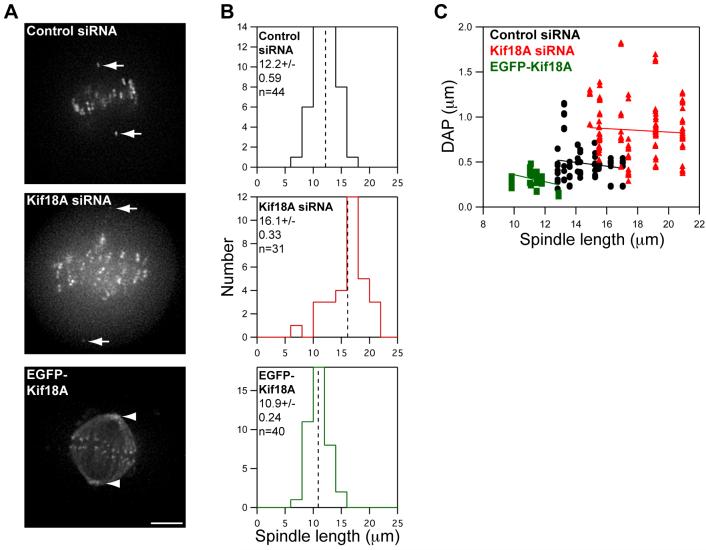
Figure 3. Kif18A’s effects on oscillations are not an indirect effect of changes in spindle length.
(A) Images of live HeLa cells expressing Venus-centrin and EGFP-CENP-B (control and Kif18A siRNA) or EGFP-Kif18A. Spindle lengths were determined by measuring the distance between Venus-centrin foci (arrows) or EGFP-Kif18A spindle pole labeling (arrowheads). Scale bar is 5 μm.
(B) Histograms of spindle lengths measured in live cells. The mean ± SEM is given for each distribution and the mean position is marked by a vertical dotted line. “n” indicates the number of cells analyzed. Spindle lengths in Kif18A-depleted and EGFP-Kif18A expressing cells are significantly different from those in control-depleted cells (p = 4.4 × 10⁻⁷ and 0.002 respectively).
(C) Scatter plot of deviation from average position (DAP) measurements as a function of spindle length. Black circles = control siRNA, red triangles = Kif18A siRNA and green squares = EGFP-Kif18A. Lines represent regression fits to each data set.

