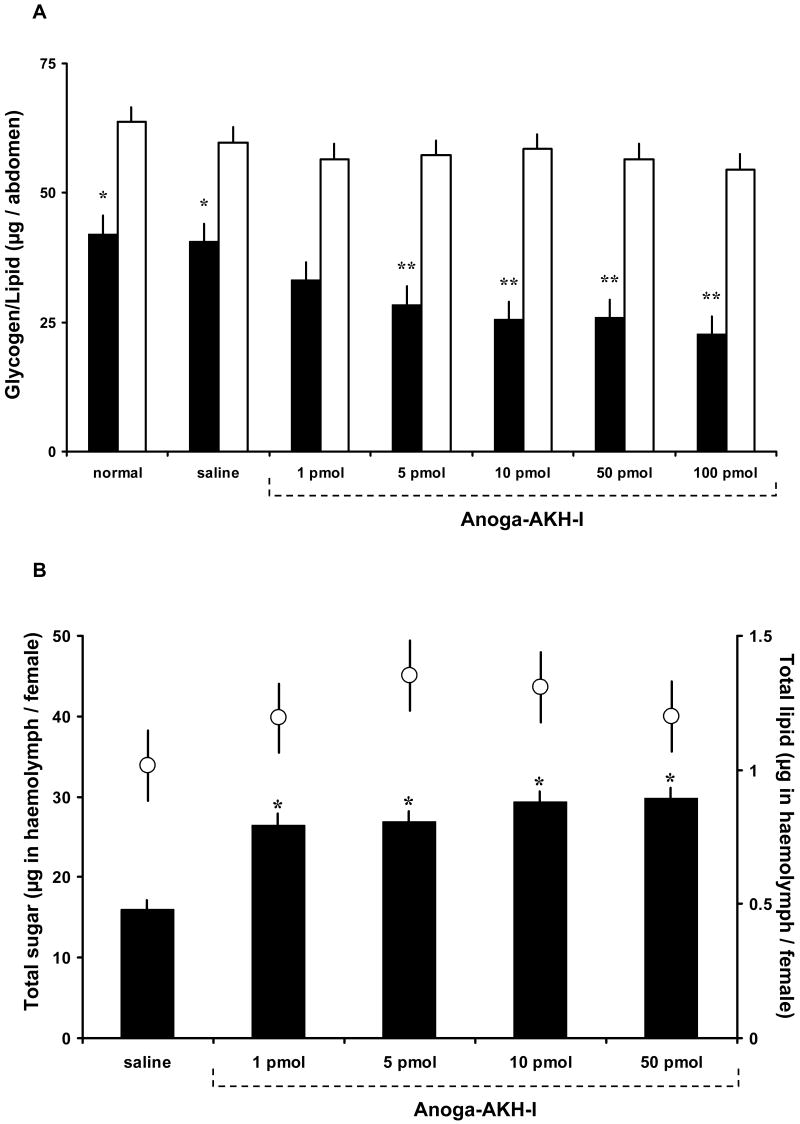
Figure 1.
Glycogen and lipid levels in sugar-fed female A. gambiae treated with different doses of Anoga-AKH-I. (A) Amount of glycogen (black bars) and total lipid (white bars) in abdomens of females injected with Anoga-AKH-I after 1.5 h incubation. Columns with one asterisk differ significantly from columns with two asterisks (Tukey-Kramer HSD test, p ≤ 0.05; M±S.E.; 3 cohorts, n = 10/cohort). (B) Amount of soluble carbohydrates (black bars) and lipid (white circles) in haemolymph of females treated as in A. Carbohydrates increased significantly in females treated with all doses of Anoga-AKH-I, relative to that of control females. Lipid levels (average of 1.1 ± 0.2 μg / female) of Anoga-AKH-I and control females showed no statistical difference. Asterisks indicate significant differences to saline controls (Tukey-Kramer HSD test, p ≤ 0.05; M±S.E.; 3 cohorts, N = 8-10/cohort).

