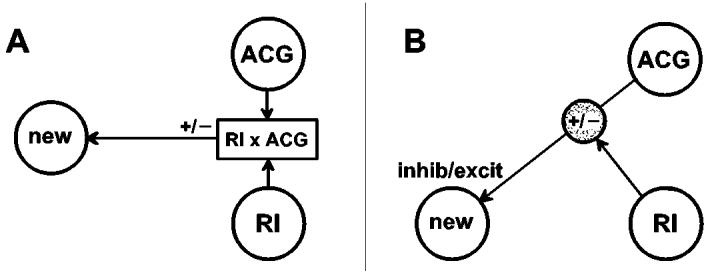
Figure 1.

Basis of physiophysiological (PPI) connectivity analysis. A. Mathematical scheme: interaction between regions RI and ACG (chosen a priori) is correlated positively or negatively to activity in ‘new’ region revealed by analysis. B. Physiological interpretation: effective connection between ACG and ‘new’ region is modulated positively or negatively by RI. In addition, the connection may tend either to excite or to inhibit activity in the new region.
