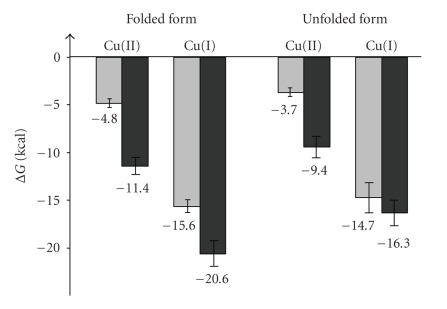
Figure 8.
Gibbs free energies (in kcal/mol) corresponding to the formation of the complexes between copper (in both redox states) and the apoprotein (in the folded and unfolded forms), that is, corresponding to the equilibria (3) and (4) of Scheme 1. Light and dark grey bars correspond to data at pH 2.5 and pH 7.0, respectively. For the sake of clarity, the values of ΔG 0 associated to each process are explicitly indicated at the bottom of each bar.

