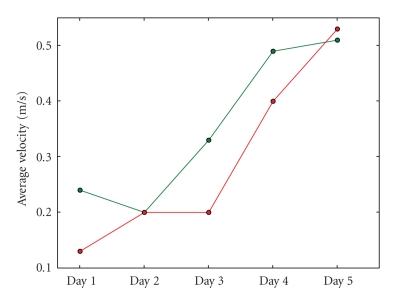
Figure 14.
The evolution of the average velocity during sessions over all five days for subject 1. The lower line represents the performance when driving without filter, the upper one the average velocity when the filter is active. It is clear that the overall performance (with and without filter) improves significantly over the course of days.

