
Figure 5.
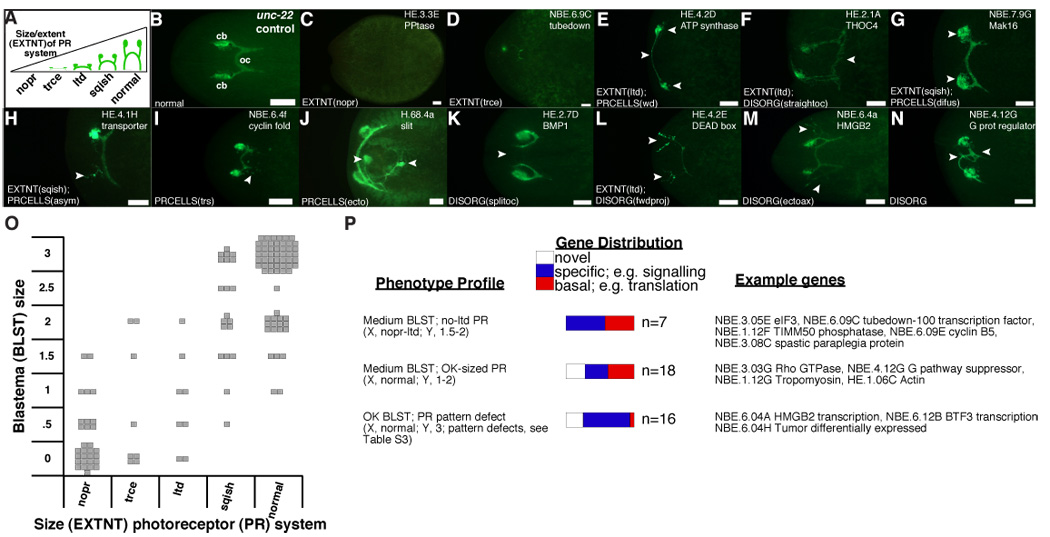
Analyses of blastema differentiation and pattern formation in animals with screen phenotypes. (A–N) Anterior, left. (A) Photoreceptor system defect terminology. EXTNT, photoreceptor regeneration extent abnormal; descriptors: nopr, no photoreceptors; trce, trace development; ltd, limited development; sqish, slightly underdeveloped. (B) Normal photoreceptors. oc, optic chiasmata. cb, cell bodies. (C–N) Representative defects. Bar, 0.1 mm. Arrowheads, abnormalities. PRCELLS, photoreceptor cell bodies abnormal. Descriptors: wd, photoreceptors wide; difus, diffuse clustering; asym, asymmetry; trs, tears, ectopic neurons posterior to cluster; ecto, ectopic photoreceptor. DISORG, axon disorganization. Descriptors: straightoc, oc straight; splitoc, axons fail to cross midline; fwdproj, cell body projections toward anterior tip; ectoax, extra projections. H.68.4A RNAi cephalic ganglia were also labeled with α-synaptotagmin. (O) Cellular defect categorization. Left, each square represents mean phenotype of animals with a single gene inhibited. Y, blastema sizes: "0" (none) and "3" (normal). (P) X, Y scatter-plot coordinates for "phenotype profiles" are listed. Genes categorized as in 3B. Complete listing of data is in Table S3.