
Figure 6.
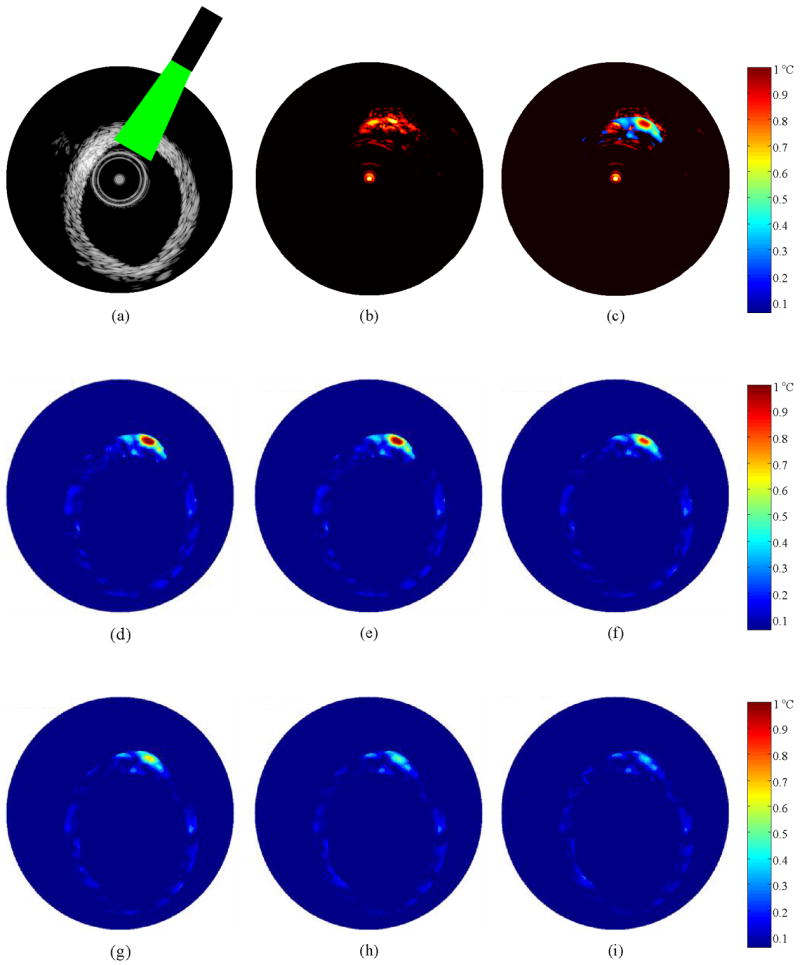
(a) IVUS B-Scan image of a normal arterial tissue with the laser illumination in the 12 o'clock to 1 o'clock region, (b) Image of the photoacoustic response from the region of laser incidence, (c) Image displaying the temperature increase immediately following the laser excitation overlaid on the photoacoustic response, (d-i) Temperature maps obtained from the arterial tissue at 0.1, 1, 5, 10, 15 and 20 ms following IVPA imaging. The maximum temperature observed at 0.1 ms after laser incidence is 1.1°C. The region of the arterial tissue was subject to a laser radiant exposure of 60 mJ/cm2.