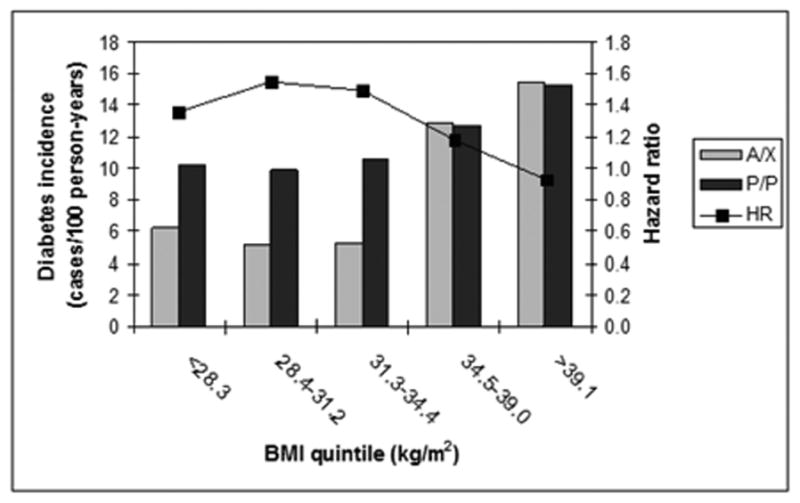
Figure 2.

Interaction of BMI with genotype at PPARG P12A on diabetes risk. The bar plot (left axis) shows incidence of diabetes (cases/100 person-years) in the placebo arm by quintile of baseline BMI for either alanine carriers or proline homozygotes at PPARG P12A. The line plot (right axis) shows the hazard ratio (HR, P/P versus A/X) in the full DPP cohort by quintile of baseline BMI. The protective effect of alanine seems to disappear at BMI >34.5 kg/m2.
