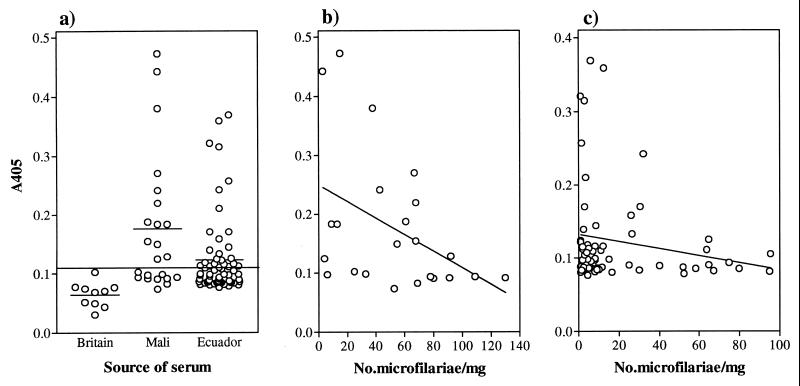
Figure 4.
ELISA analysis of the IgG response to MOv14 of human onchocerciasis infection sera. (a) Comparison of the response of individuals from two onchocerciasis endemic foci with uninfected British controls. Group mean values are represented by a short, horizontal line. The cut-off value is represented by a horizontal line across the graph and is derived from the mean of the control values plus 2 SD. Relationship between microfilarial skin density and anti-MOv14 IgG levels in a Mali focus (b) and an Ecuador focus (c).

