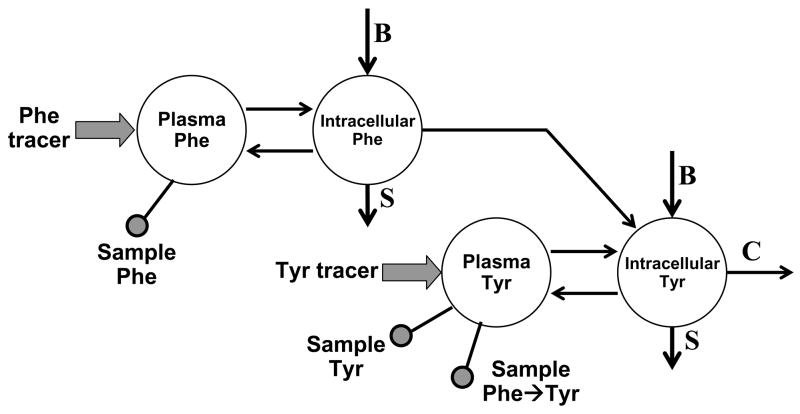
FIGURE 5.
Model of whole body phenylalanine and tyrosine metabolism including intracellular pools. The model is similar to that shown in Fig. 2. The arrows are labeled with “B” for rate of phenylalanine or tyrosine entry into the intracellular phenylalanine and tyrosine pools from protein breakdown, “S” for rate of phenylalanine or tyrosine uptake from the intracellular pools for new protein synthesis, and “C” for rate of tyrosine oxidation. The model shows infusion inputs for a phenylalanine and a tyrosine tracer (wide arrows) and for sampling from plasma (ball and stick indicator) for phenylalanine tracer enrichment, tyrosine tracer enrichment, and phenylalanine tracer converted to tyrosine (Phe→Tyr).

