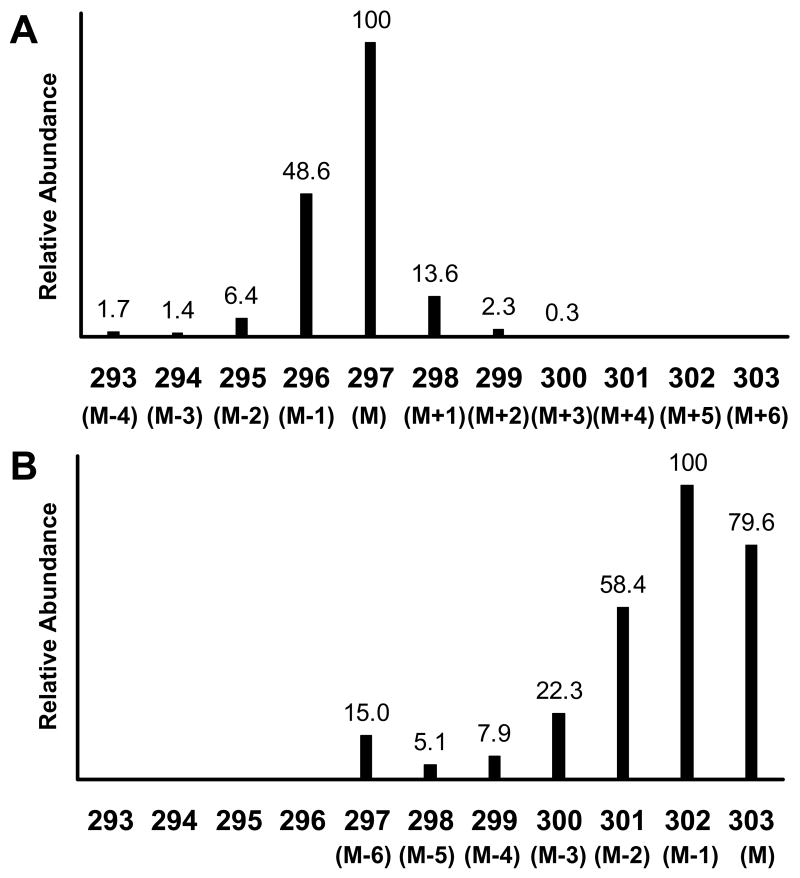
Figure 4.
Mass spectra of the bis-butylboronate acetyl derivative of unlabeled (panel A) and [U-13C]glucose (panel B) obtained by electron impact ionization GCMS. The presented spectra are focused on the [M-57]+ ion (defined as M for each isotopomer) and its naturally occurring isotope ions for each isotopomer. Intensities are shown as relative abundance for each ion relative to the base mass M of each isotopomer. The numerical values for the x-axis are the measured m/z values. The figure represents the data obtained from Experiment 3.

