
Fig. 1.
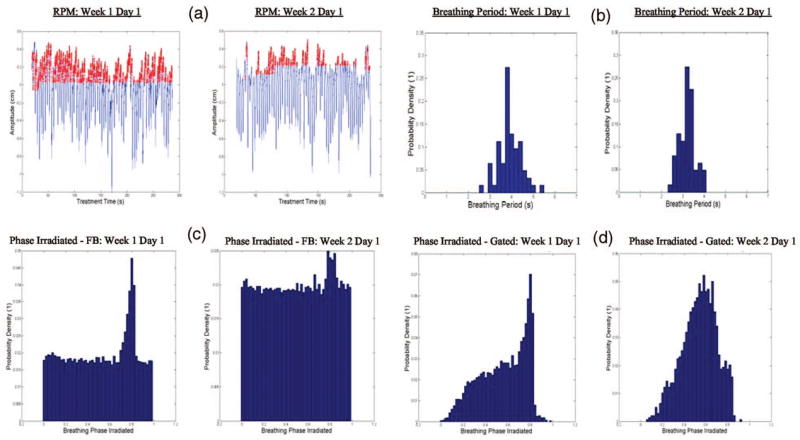
(a) Breathing amplitude as a function of treatment time is shown as an example to illustrate the variation between treatment fractions considering the RPM signals for free-breathing (in blue) and the gated treatment (in red); (b) PDF for the breathing period on days 1 and 6; (c) PDF for the breathing phase irradiated in free-breathing for a single day (days 1 and 6); (d) PDF for the breathing phase irradiated for gated treatment for a single day (days 1 and 6).