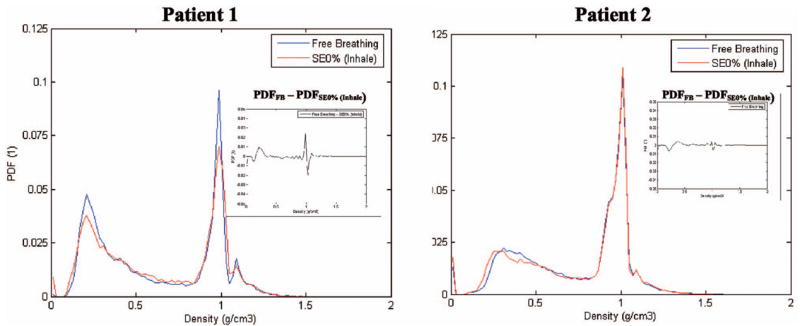
Fig. 3.

Comparison of the probability tissue-density function in the PTV for Patients 1 and 2 comparing CT scanning methods: (a) Helical 3DCT scan with patient under free-breathing and (b) 4DCT scanning with the SE0% (inhale phase) represented in the figure. This illustrates density variations due to patient breathing.
