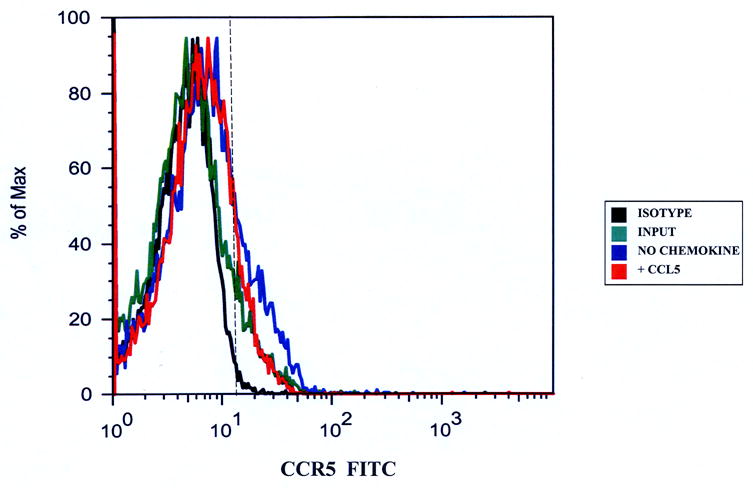
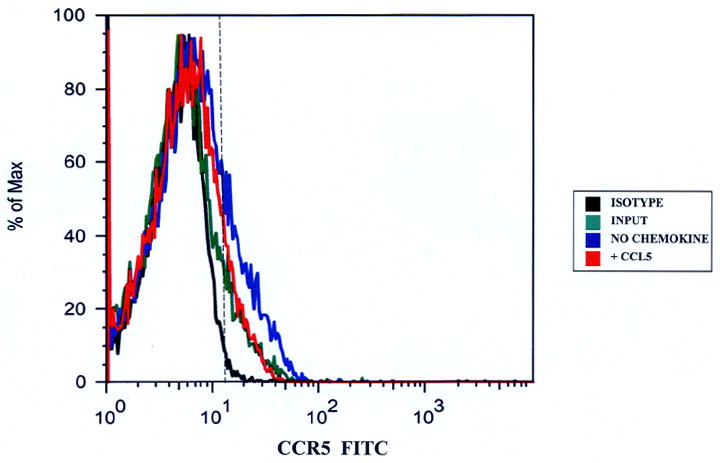
Figure 2.


CCR5 expression on CD14+ monocytes migrating to CCL5. Migrated CD14+ monocytes were stained with anti-CCR5 antibodies to determine receptor expression. There was an increased proportion of CCR5+ monocytes that migrated without added chemokines relative to the input, indicative of monocyte activation during the transmigration assay in both the basal IVBBB (Figure 2a) and aIVBBB (Figure 2b). There was a reduction in the proportion of migrated CD14+CCR5+ monocytes following CCL5-driven migration relative to the migrated population without added chemokines in both models, indicative of CCR5 down-regulation following ligand-induced transmigration. Shown are histograms from representative experiments (n=5). The vertical hashed line represents the gating index for these experiments based on the shown isotype control histogram. Key: aIVBBB: cytokine-activated in vitro blood-brain barrier, IVBBB: in vitro blood-brain barrier.
