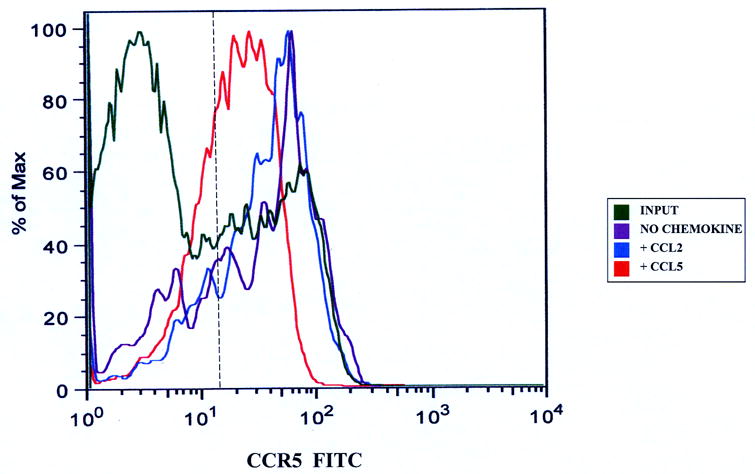
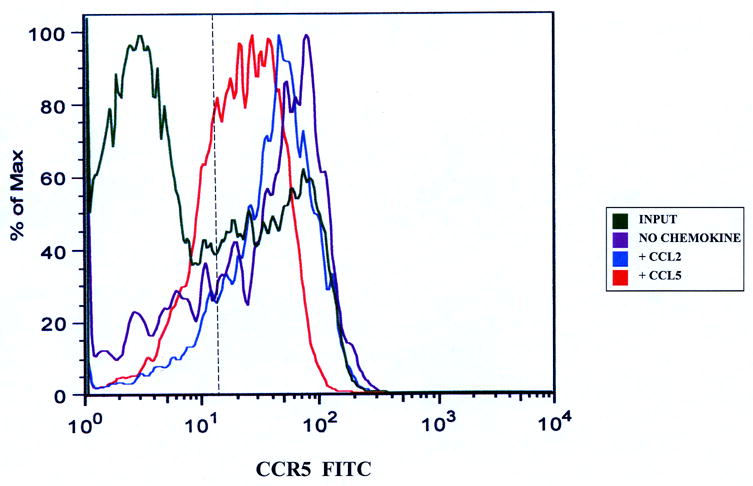
Figure 3.


CCR5 expression on CD3+ T-cells migrating to CCL5. Migrated CD3+ T-cells were stained with anti-CCR5 antibodies to determine changes in receptor expression as stated in the Materials and Methods section. There was down-regulation in CD3+ T-cell CCR5 expression following CCL5-driven migration across the basal IVBBB (Figure 3a) and aIVBBB (Figure 3b). This was based on a reduction in mean fluorescent intensity (MFI) relative to the input, as well as to T-cells migrating without added chemokine and to a non-CCR5 binding chemokine, CCL2. Shown are histograms from representative experiments (n=3). The vertical hashed line represents the gating index for these experiments based on the isotype control.
