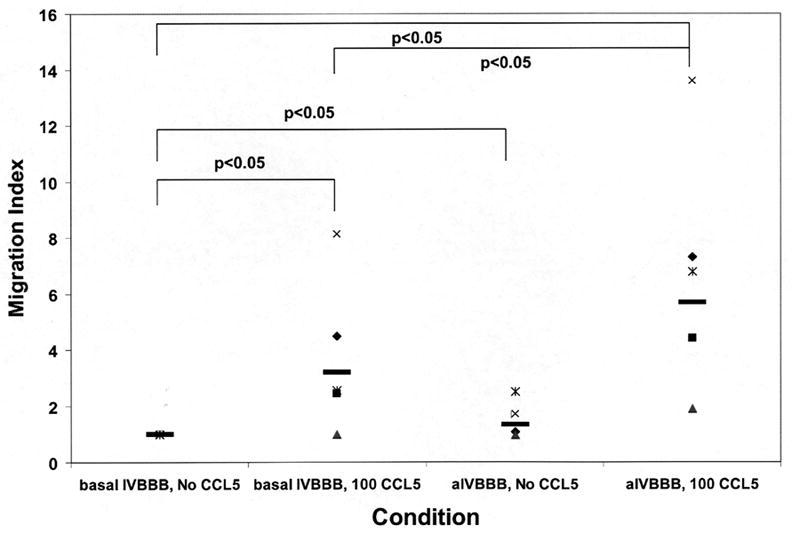
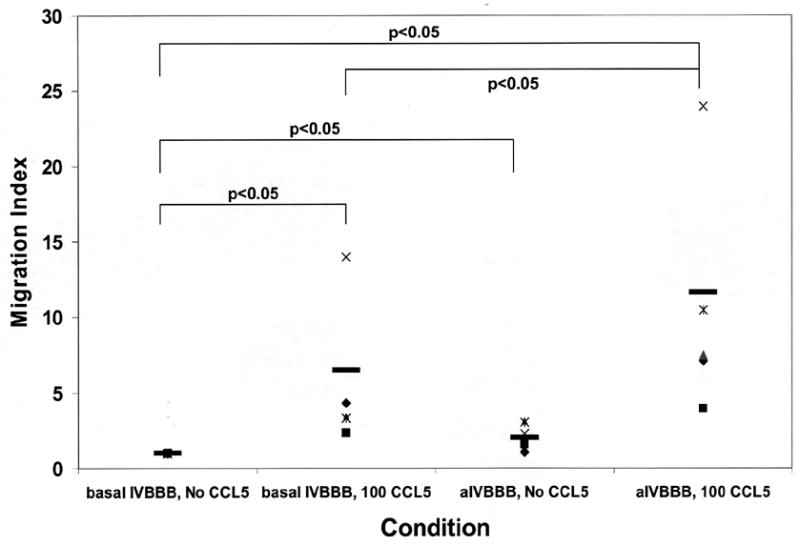
Figure 4.


Migration index scatter plots for CCL5-driven T-cell migration across basal IVBBB and aIVBBB. Calcein-AM labeled PBMCs were used for quantification, while parallel transmigration assays using unlabeled PBMCs stained for CD14, CD3 and CCR5 expression were analyzed by flow cytometry as described in the Materials and Methods section. Shown are the CD3+ T-cell migration index data across the basal IVBBB and aIVBBB (Figure 4a) in response to 100 ng/mL CCL5 at 3 hours for five separate experiments using different donors. This demonstrates significantly increased T-cell migration to CCL5. There was also a significant increased migration index of CD3+CCR5+ T-cells (Figure 4b) in response to CCL5 across both models, indicative of efficient migration of receptor positive T-cells. The aIVBBB facilitated increased total and receptor-specific T-cell migration to CCL5 relative to the basal IVBBB. Key: aIVBBB: cytokine-activated in vitro blood-brain barrier, IVBBB: in vitro blood-brain barrier.
