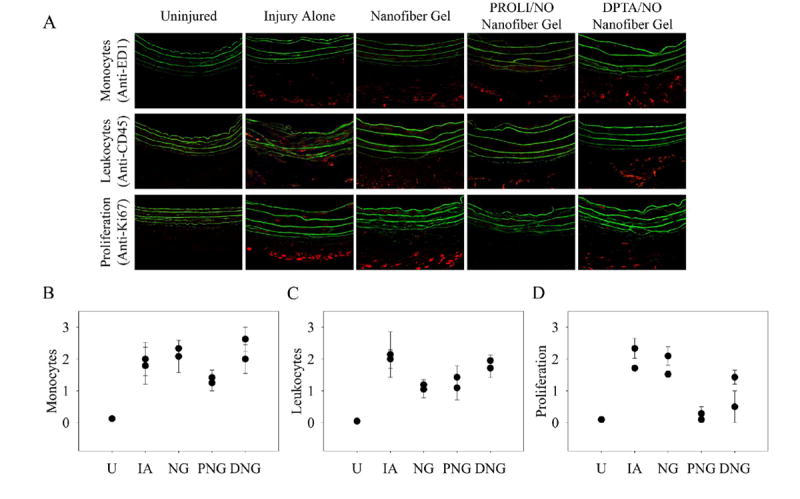
Figure 5.

Immunofluorescence staining for markers of inflammation and proliferation. A) Representative sections (400x magnification) from uninjured, injury alone, nanofiber gel, PROLI/NO nanofiber gel, and DPTA/NO nanofiber gel treatment groups (n=2 per group, 3 sections per animal). Positive staining is indicated by red and elastic lamina is green. Graphical representation of scoring by 8 blinded observers (scale 0-3) for B) monocytes (anti-ED1), C) leukocytes (anti-CD45) and D) proliferation (anti-Ki67). Each data point represents scoring for a particular animal. U=uninjured, IA=injury alone, NG=nanofiber gel, PNG=PROLI/NO nanofiber gel, and DNG=DPTA/NO nanofiber gel.
