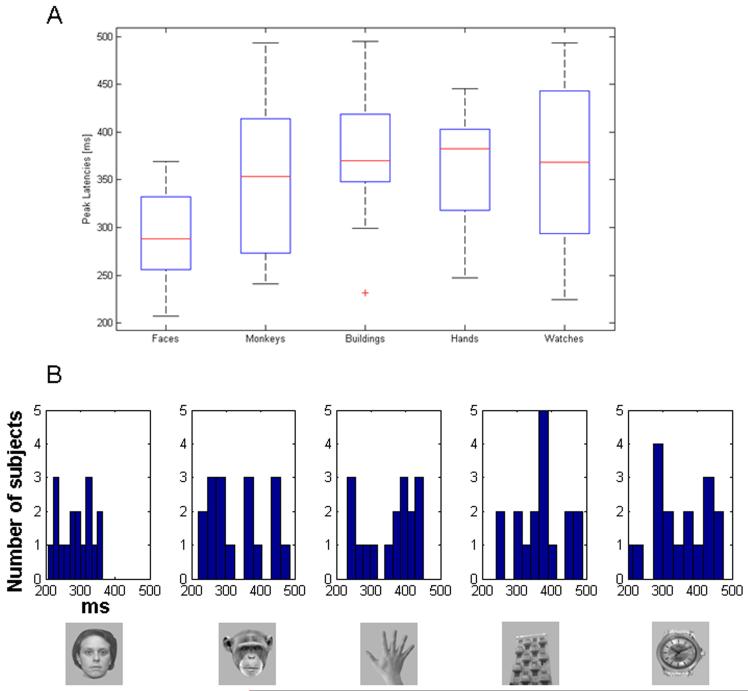
Figure 3.
Distribution of the peak latencies of maximal iGBA activity for each stimulus category (A) Box plots of the latencies. The line in the middle of each box is the sample median, while the top and bottom of the box are the 25th and 75th percentiles of the samples, respectively. Lines extend from the box to show the furthest observations. (B) Distribution of latency values from all subjects for each category. The mean latency of iGBA peaks for human faces was earlier than for the other categories. In addition, the peak latencies of individual subjects in response to human faces are more concentrated around the mean while for the other categories there is more dispersion.

