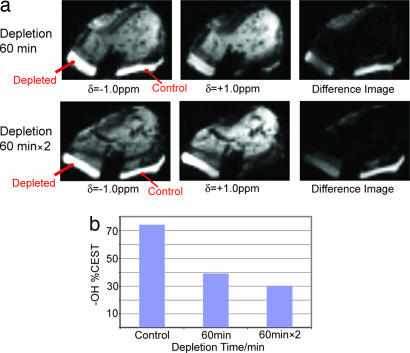
Fig. 4.
CEST images taken from a trypsinization series on one bovine patella (a) along with the CEST contrast extracted according to Eq. 3 (b). One side (marked depleted) was trypsinized for 60 min (Upper) and twice for 60 min (Lower), while the control side stayed immersed in PBS. The difference image represents the subtraction of the image at δ = +1.0 ppm from the image at δ = −1.0 ppm. The total duration of the presaturation pulse sequence was 320 ms at an average rf power of 42 Hz.

