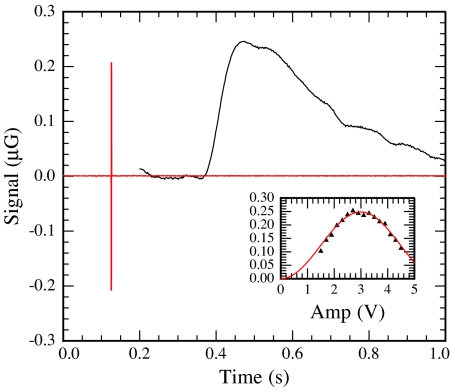
Fig. 3.
Magnetic field due to water in detection region (black trace) following a π pulse in the encoding region (red trace). Data shown here are the result of averaging over ≈10 π pulses. (Inset) Peak signal as a function of AF amplitude to calibrate the π pulses. Units on the vertical axis are the same as those in the main figure.

