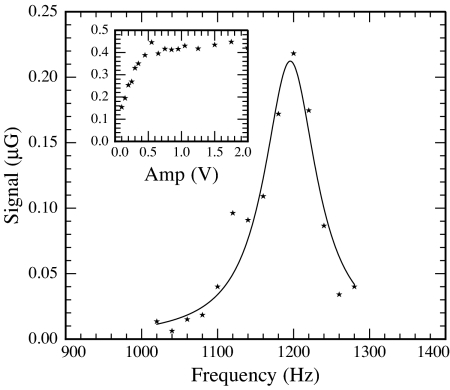
Fig. 5.
Magnetometer signal for continuous application of weak AF in encoding region as a function of frequency. The solid line overlaying the data is a fit to an absorptive Lorentzian, resulting in a half-width at half-maximum Δν = 43 Hz. (Inset) Signal as a function of amplitude of the AF, tuned to resonance (units on the vertical axis are the same as those in the main figure). The data in the main figure were obtained at the minimum amplitude value of applied AF shown in Inset.

