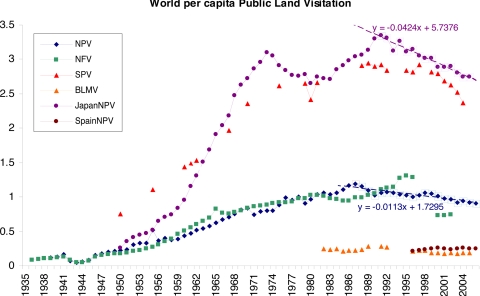
Fig. 1.
Annual per capita visitation to the various U.S. and international public lands in this study. Included were U.S. National Parks (variable NPV, range of time series 1939–2006, n = 68), U.S. State Parks (SPV, 1950–2003, n = 24), U.S. National Forests (NFV, 1939–2002, n = 61), U.S. Bureau of Land Management sites (BLMV, 1982–2005, n = 20), Japanese National Parks (JapanNPV, 1950–2005, n = 56), and Spanish National Parks (SpainNPV, 1996–2006, n = 11). Linear regressions for declines from identifiable peaks in NPV (1987) and JapanNPV (1991) are represented by lines and equations.

