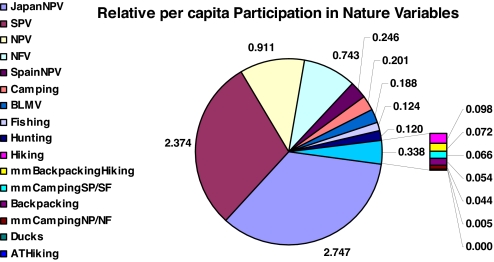
Fig. 2.
Annual per capita participation for all 16 of the nature recreation variables included in any part of our analysis. See Table 1 for a complete description of variables and sources. None of the variables are mutually exclusive nor are they exhaustive. The figure is meant merely to compare relative per capita participation in the recreation choices we address.

