Fig. 1.
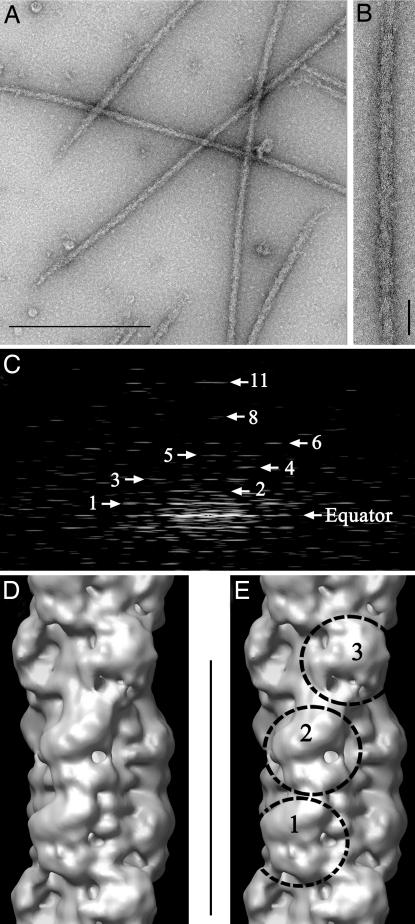
Isolation and 3D reconstruction of mouse cardiac thick filaments. (A) Electron micrograph of negatively stained filaments. (Scale bar, 500 nm.) (B) Portion of isolated filament, with bare zone at top. (Scale bar, 43 nm.) (C) Fourier transform of B showing layer lines at orders (numbered) of 42.9-nm repeat. (D and E) Surface views of thick filament reconstruction (filtered to 4.0-nm resolution), showing a single 42.9-nm repeat (scale bar), oriented so that bare zone would be at top. Myosin heads project from the surface at three levels (crowns 1, 2, and 3) in each repeat.

