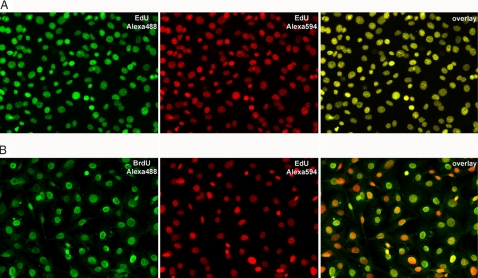
Fig. 3.
Reproducibility of EdU labeling (A) and comparison with BrdU (B). (A) NIH 3T3 cells labeled by incubation overnight with 2 μM EdU were fixed and reacted successively with 10 μM Alexa488-azide and 10 μM Alexa594-azide, respectively, as described in Materials and Methods. The cells were imaged by fluorescence microscopy. (Left) Alexa488-azide stain. (Center) Alexa594-azide stain. (Right) Overlay of the Alexa488 and Alexa594 images. The complete colocalization of the two colors indicates that the two successive azide stains detect ethynyl groups that have the same distribution within the cell nucleus. (B) NIH 3T3 cells labeled by incubation overnight with 2 μM EdU and 2 μM BrdU were fixed and reacted with 10 μM Alexa594-azide, followed by standard BrdU immunodetection by using an anti-BrdU monoclonal antibody and an Alexa488-conjugated secondary antibody. (Left) BrdU stain. (Center) EdU stain. (Right) Overlay of the BrdU and EdU images. Note that each cell that incorporated BrdU also incorporated EdU. The BrdU micrograph was taken by using a five-times longer exposure than the exposure used for EdU (500 ms compared with 100 ms) under identical digital camera settings.

