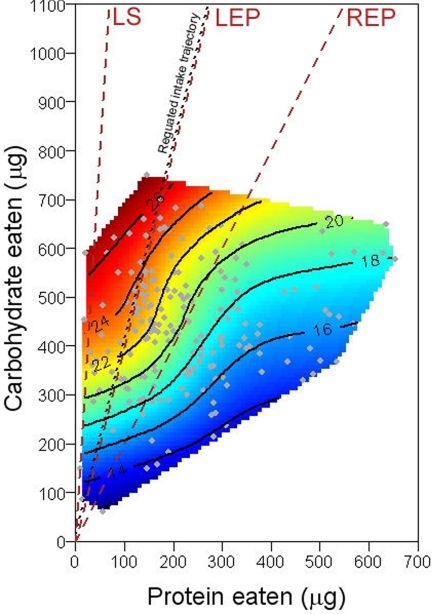
Fig. 4.
Longevity landscape fitted to 6-day macronutrient intake by individual flies (gray dots) across the nine treatments in the choice experiment. Dashed brown lines show P:C ratios that maximized lifespan (LS), lifetime egg production (LEP), and rate of egg production (REP) in no-choice experiments (Fig. 1).

