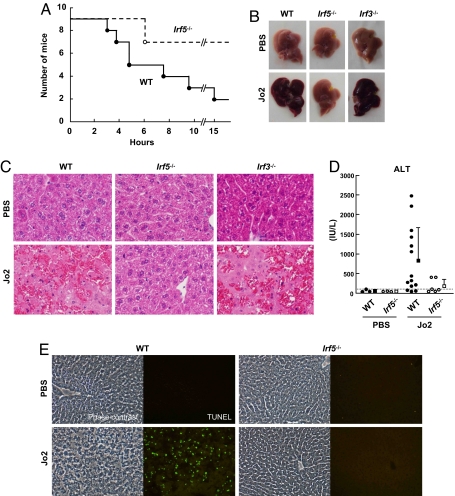
Fig. 1.
Resistance to Fas-induced hepatic apoptosis and lethality in Irf5−/− mice. (A) Survival curves of WT and Irf5−/− mice i.p. injected with 15 μg of an agonistic Fas mAb (Jo2) or PBS. (B) Macroscopic appearance of livers 5 h after Jo2 injection. (C) Hematoxylin-eosin stains of livers 5 h after Jo2 injection. (Original magnification, ×200.) (D) Serum ALT levels 3 h after administration of Jo2 mAb. Circles indicate the ALT level of individual mouse. Squares and the error bars represent the average and SD of each group, respectively. (E) TUNEL assay of the livers 5 h after Jo2 mAb injection. (Original magnification, ×200.)

