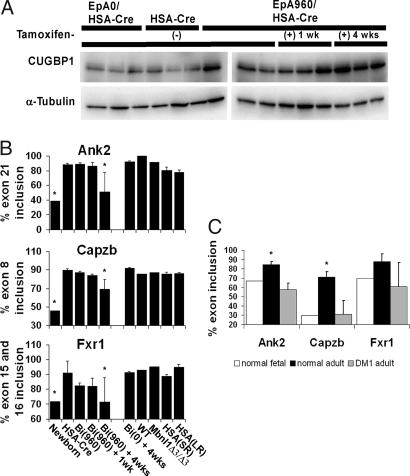
Fig. 4.
Increased CUGBP1 expression is a potential mechanism for muscle wasting in EpA960/HSA-Cre-ERT2 mice. (A) EpA960/HSA-Cre-ERT2 mice show increased steady state levels of CUGBP1 protein by Western blot analysis. (B) Percentage inclusion of alternative exons in Ank2, Capzb, and Fxr1 in skeletal muscle tissues across several time points after tamoxifen in EpA960/HSA-Cre-ERT2 mice and from two other DM1 mouse models. Each bar is a mean of biologic replicates with standard deviation when n is >1. Lanes: Newborn, day 1 newborn limb (n = 1, sample is pool of 12 animals); HSA-Cre, HSA-Cre-ERT2 no tam (n = 3); Bi (960), EpA960/HSA-Cre-ERT2 no tam (n = 3); Bi (960) + 1 wk, EpA960/HSA-Cre-ERT2 1 week after tam (n = 3); Bi (960) + 4 wks, EpA960/HSA-Cre-ERT2 4 weeks after tam (n = 3); Bi (0) + 4wks, EpA0/HSA-Cre-ERT2 4 weeks after tam (n = 3); WT, wild-type control for Mbnl1Δ3/Δ3 (n = 1); Mbnl1Δ3/Δ3, Mbnl1Δ3/Δ3 (n = 1); HSA(SR), HSASR, similar to HSALR but contains 5 CTG repeats (n = 3); HSA(LR), HSALR (n = 3). Each animal group was compared with HSA-Cre, and any statistically significant differences were determined by Student's t test, P < 0.05 (*). (C) Percentage inclusion of alternative exons in Ank2, Capzb, and Fxr1 in human skeletal muscle samples from normal fetal (white n = 1) and adult (black n = 3) tissue as well as adult DM1 tissue (gray n = 5 or 6). *, The normal adult skeletal muscle sample has a statistically significant difference from both the normal fetal and adult DM1 tissue samples, determined with the Student's t test, P < 0.05. Gel images for B and C are in SI Figs. 11 and 12, respectively; information on human samples is located in SI Table 2.

