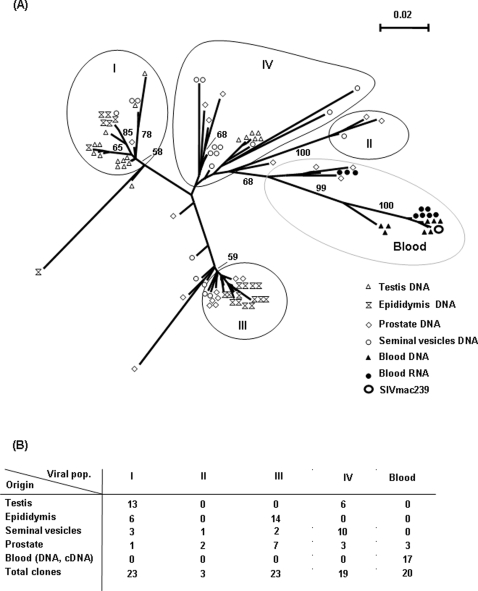
Figure 5. Viral populations in the MGT.
(A) Phylogenetic analyses of V1-V2 sequences from quasi-species obtained from reproductive tissues (white symbols) and blood (black symbols) of a high chronic macaque at necropsy. Trees were built with PAUP* version 4b10. Major significant phylogenetic clusters in the MGT are rounded in black and numbered I to IV. The numbers near nodes indicate the percentage of bootstrap replicate (100 resamplings). The scale refers to the distance between sequences. (B) Tissue origins of the clones present in the different viral populations.

