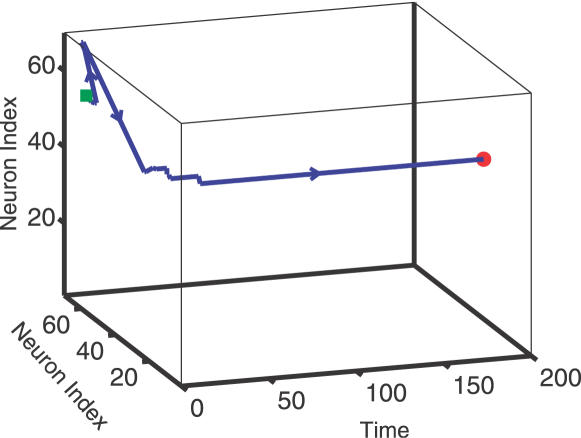
Figure 2. During retrieval, the peak of the local overlap drifts away from its initial position.
This figure shows the trajectory that the peak of the local overlap follows during the simulation reported in Fig 1. The green square represented the position of the peak of the local overlap at the beginning of the simulation (Fig. 1A) and the red circle represents the position of the peak after 200 time steps (Fig. 1B). Over the first ∼40 time steps the local overlaps drifts until it settles into an equilibrium state.

