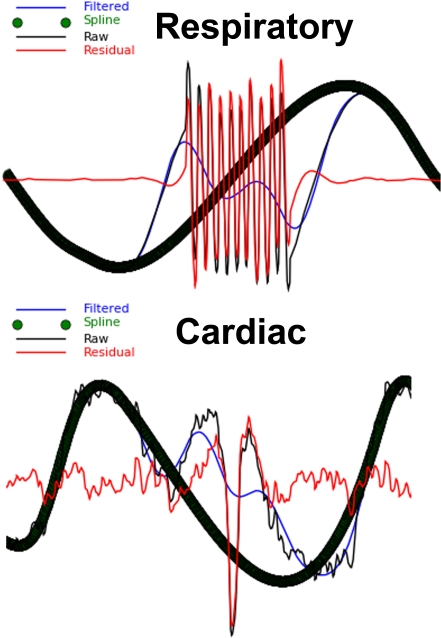
Figure 2. Plot of Physiological Signal Artifact.
The raw respiratory and cardiac waveforms are plotted along with their filtered versions. Signal artifacts with large residuals (Raw Signal-Filtered Signal) are replaced with a spline interpolation. The series of green spline circles are the thick black waveform.

