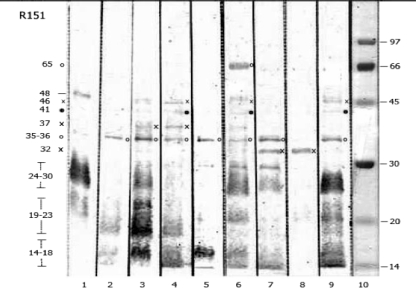
FIG. 1.
IgM reactivities of sera from patients with leptospirosis. Representative immunoblots are shown in lanes 1 to 9. Symbols (×, ○, and •) indicate the locations of reactive antigen bands in the blots and their sizes on the left side of the figure. Lane 10 shows the locations of molecular size standards.

