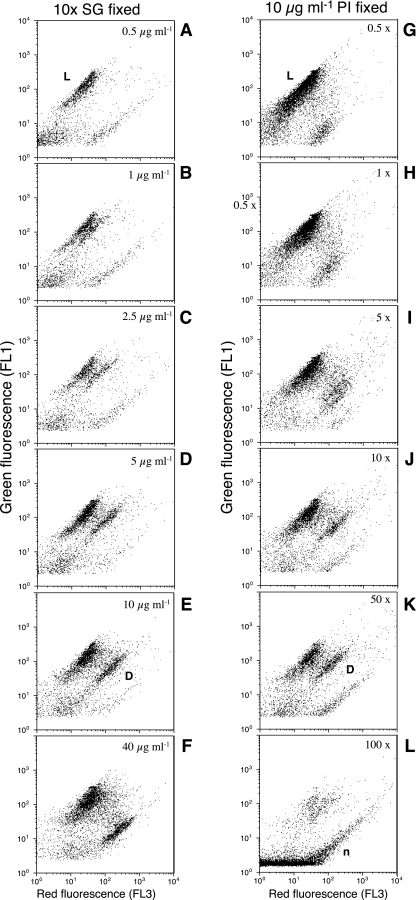
FIG. 1.
Flow cytometric dot plots of red (FL3) versus green (FL1) fluorescence of seawater bacteria stained simultaneously with SG1 and PI at different dye concentrations. The samples correspond to Mediterranean seawater subjected at 70°C in a water bath for 1 min. Left panels (A to F) show results for an SG concentration fixed at 10× and various concentrations of PI. Right panels (G to L) show results for a PI concentration fixed at 10 μg ml−1 and various concentrations of SG. “Live” cells (not stained by PI) are labeled as L. Dead cells (stained by PI) are labeled as D. Flow cytometric noise is labeled as n.

