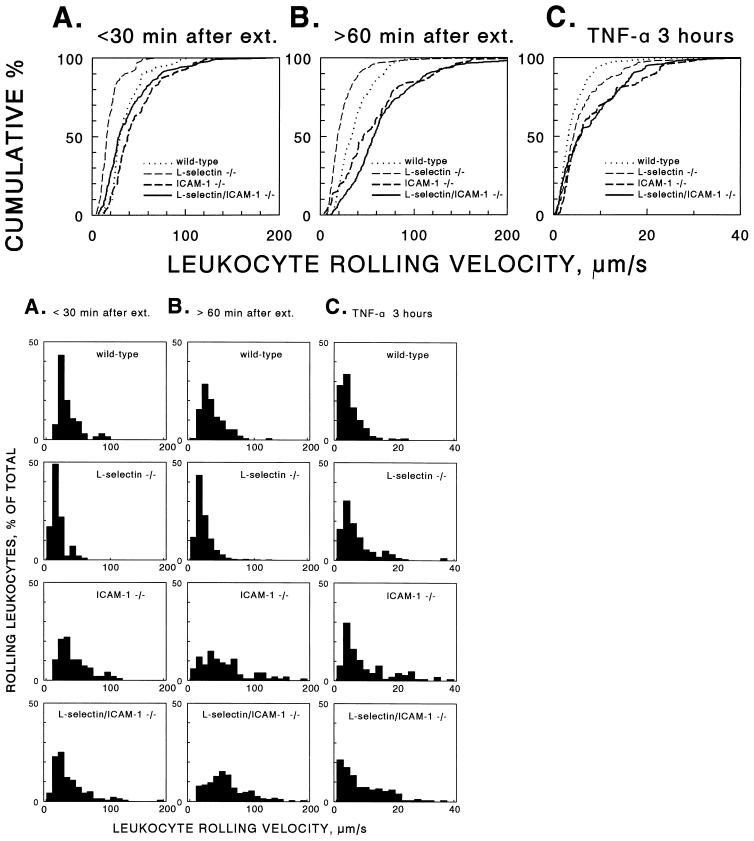
Figure 2.
Cumulative (Upper) and conventional histograms of the distribution of leukocyte rolling velocities in adhesion molecule-deficient mice. Rolling velocities were measured in hemodynamically similar cremaster venules after surgical exteriorization at times <30 min (A) and >60 min (B). (C) Mice also were pretreated with an intrascrotal injection of TNF-α 2.5 hr before the initiation of surgery. Cumulative frequency analysis (top row) ranks all individual cells analyzed in each mouse genotype from the cell with the highest rolling velocity (100%) to the lowest (<1%) on the y axis and plots these values as the percentage of cells that had a velocity lower than the value indicated on the x axis. Cumulative frequency analysis allows direct comparison between data sets and makes the distribution independent of bin size (Lower; 10-μm/s bins in A and B, 2-μm/s bins in C) used in conventional histograms. For numbers of venules and cells examined and statistical analysis of results see Table 2. The data from wild-type and L-selectin−/− mice treated with TNF-α are published (12).

