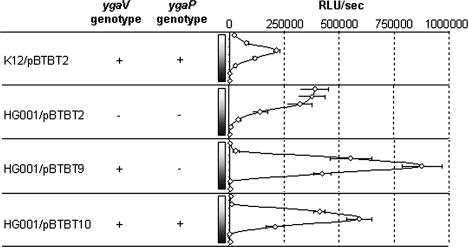
FIG. 3.
Effect of the ygaVP deletion on the induction of bioluminescence by TBT. Increasing concentrations of TBT used (0, 0.1, 0.5, 1, 2, 5, and 10 μM) are indicated for each result by a rectangle with a gradient from white (0 μM) to black (10 μM). Values on the graph represent the means of three independent experiments for each concentration of TBT for each strain. RLU/s, relative luminescence units/s.

