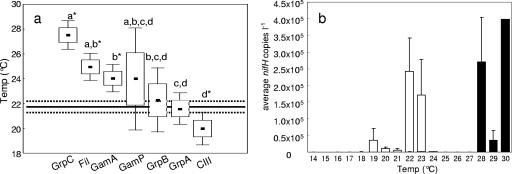
FIG. 2.
Box-whisker plots (black dots, mean; boxes, standard error; bars, 95% confidence interval) show the temperatures where >100 nifH copies liter−1 were detected for all phylotypes in panel a. The mean temperature of all samples (22°C) and the associated standard error are indicated by a black line and dashed line, respectively. Phylotype temperature means which are significantly different from 22°C (P < 0.05, Kruskal-Wallis test) are identified by asterisks. Letters signify groups of phylotypes whose temperature means are not significantly different from another group (Mann-Whitney U test). Average filamentous and group A nifH copies liter−1 detected at sample temperatures rounded to the nearest whole degree are displayed in panel b. Error bars indicate the standard error.

