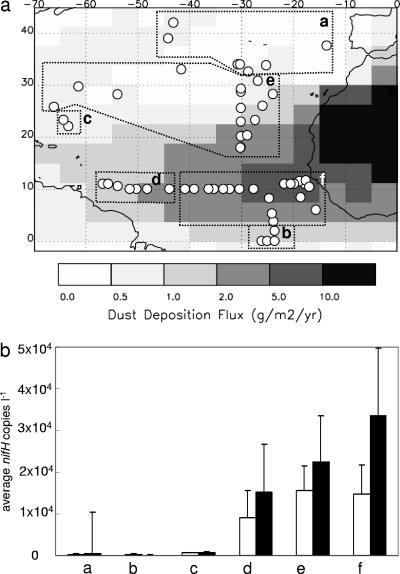
FIG. 3.
Separation of stations according to geographical location (a) and physical characteristics (see the supplemental material). Station locations are overlaid on a map of predicted annual dust deposition. The average number of nifH copies liter−1 and standard error from all samples (clear bars) and only surface samples (black bars) in each region are plotted in panel b. Region letters correspond to the panels in Fig. 4. Sonne 152 samples were not plotted because no temperature and salinity data were available.

