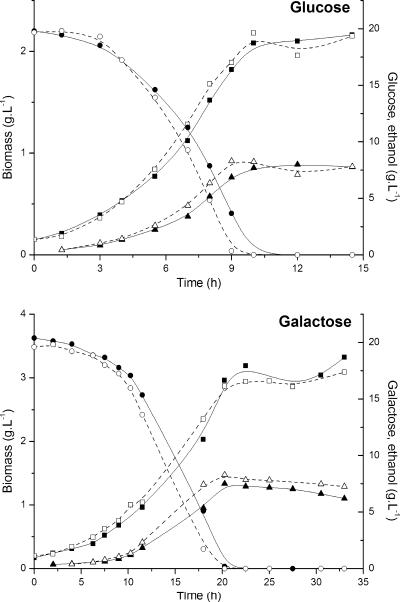
FIG. 2.
Data from glucose and galactose cultivations with strains T1 and T1-E. Concentrations of glucose or galactose (circles), ethanol (triangles), and biomass (squares) were monitored during shake flask cultivations (as described in Materials and Methods). Solid symbols and solid lines correspond to T1 cultures; hollow symbols and dotted lines correspond to T1-E cultures.

