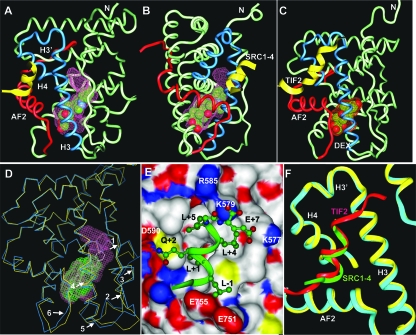
FIG. 3.
Crystal structure of the GR/DAC/SRC1-4 complex. (A and B) Two 90° views of the GR/DAC/SRC1-4 complex. The DAC-binding pocket is shown as a pink surface. The SRC1-4 peptide is in yellow and the bound DAC is shown in a space-filling representation with carbon and oxygen atoms depicted in green and red, respectively. Key structural elements are labeled. (C) Overall structure of the GR/DEX/TIF2 complex for comparison with the GR/DAC/SRC1-4 complex. The DEX-binding pocket is shown as a red surface. The TIF2/SRC2-3 peptide is in yellow and the bound DEX is in a space-filling representation with carbon and oxygen atoms depicted in green and red, respectively. (D) Overlay of the DAC and DEX-bound GR structures. The Cα atoms of the DAC-bound GR LBD are shown in cyan and the DEX-bound GR LBD is shown in yellow. The DAC- and DEX-binding pockets are in pink and green, respectively. Arrows indicate major differences between the DAC- and DEX-bound structures (residues E542 to D549, arrows 1 and 2; residues T556 to L566, arrows 4 and 5; residues L621 to A624, arrow 3; residues S746 and I747, arrow 6). (E) The binding mode of the SRC1-4 LXXLL (green) in the GR coactivator binding site. GR is shown as a protein surface that is colored by atom type as follows: carbon, white; oxygen, red; nitrogen, blue; sulfur, gold. SRC1-4 residues are labeled with black and the GR residues are labeled with white. (F) Structural comparison of the GR coactivator binding site between the DAC (cyan)- and DEX (yellow)-bound structures. The SRC1-4 and TIF2-4 helices are shown in green and red, respectively.

