FIG. 1.
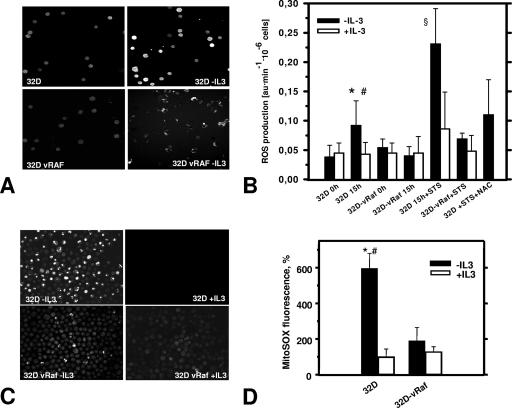
Cell death induction results in enhanced ROS production which is suppressed by IL-3 or activated RAF. (A) Representative confocal images of DCF-DA-loaded cells show that IL-3 deprivation of 32D cells (8 to 9 h) triggers release of ROS, as detected by a significant increase of DCF-DA fluorescence (top), which is suppressed by activated C-RAF (vRAF) (bottom). (B) Summary of spectrofluorophotometric ROS measurements (DCF-DA labeling experiments). In addition to its protective effect during IL-3 deprivation (15 h), vRAF protects against STS-induced ROS production (STS concentration, 5 nM), which can also be inhibited by antioxidant NAC (20 mM). Symbols: *, significantly different from 32D cells plus IL-3 (P < 0.001; n = 9); #, significantly different from vRAF cells (P < 0.01; n = 7 to 9); §, significantly different from plus-IL-3 and vRAF groups (P < 0.01; n = 4). au, arbitrary units. (C) Representative confocal images of intracellular ROS in cells preloaded with specific mitochondrial superoxide indicator MitoSOX Red (5 μM) demonstrate results of increased ROS levels and protective effects of vRAF similar to those seen for DCF-DA (panel A). (D) Statistical analysis of MitoSOX Red fluorescence intensity. ROS probe MitoSOX Red confirms results obtained with DCF-DA and suggests a mitochondrial origin of ROS. 32D and 32D-vRAF cells were deprived of IL-3 through extensive washing and set up at a density of 0.5 × 10⁶/ml. Then, 15 to 16 h later, cells were labeled with MitoSOX Red. The fluorescence signal was quantified using Scion Image software as described in Materials and Methods. Symbols: *, significantly different from control (+IL-3); #, significantly different from vRAF (−IL-3) (P < 0.001; n = 4 to 6).

