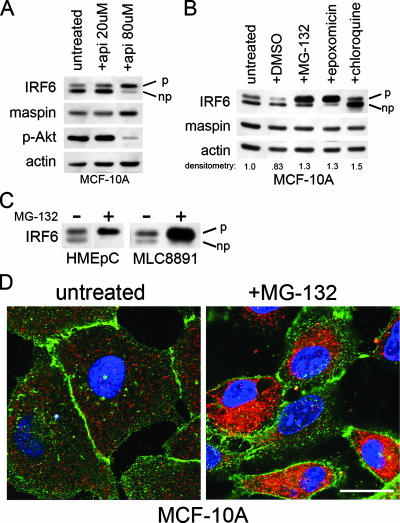
FIG. 1.
Proteasomal inhibition induces IRF6 phosphorylation. (A) Western blot analysis of MCF-10A cells treated with two different concentrations of apigenin (api) for 18 h. The IRF6 doublet represents phosphorylated (upper band, denoted by “p”) and nonphosphorylated (lower band, denoted by “np”) forms. Phospho-Akt (p-Akt) levels verify apigenin function and act as an internal control. (B) Western blot analysis of MCF-10A cells treated with proteasome inhibitors MG-132 (0.5 μM) and epoxomicin (0.5 μM), the lysosomotropic agent chloroquine (50 μM), and the vehicle dimethyl sulfoxide (DMSO). All treatments were performed for 18 h. Densitometry represents the ratio of IRF6 to actin. (C) Western blot analysis demonstrating similar effects of proteasomal inhibition on IRF6 expression and phosphorylation in primary human mammary epithelial cells (HMEpC) and the nontransformed human prostate cell line MLC8891. +, present; −, absent. (D) Immunofluorescence analysis of MCF-10A cells grown on glass coverslips and treated with MG-132 (0.5 μM, 18 h). IRF6 is shown in red. E-cadherin (green) was used to highlight cellular architecture. 4′,6′-Diamidino-2-phenylindole was used to counterstain the nuclei (blue). Images were acquired on a Zeiss 510 META confocal microscope with a total optical magnification of ×630 with an additional 2.5× scan zoom. Bar represents 10 μm.

