FIG. 4.
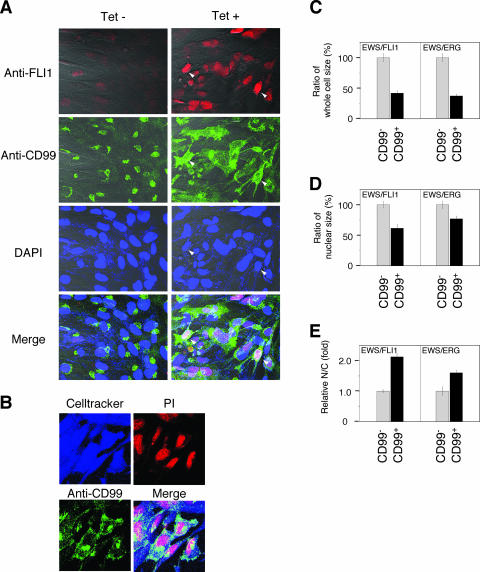
EWS/ETS expression, alteration of CD99 distribution, and cell morphological changes in UET-13 cells. (A) Immunofluorescence studies using anti-Fli1 (red), anti-CD99 (green), and DAPI (blue). UET-13TR-EWS/FLI1 cells were cultured on coverslips in the absence or presence of tetracycline (Tet) for 72 h and then stained as described in Materials and Methods. White arrowheads indicate CD99+ cells that have a strong staining pattern with anti-Fli1 antibodies and also have remarkable CD99 expression and morphological features. (B) Immunofluorescence analysis by triple staining with whole cells (Celltracker; blue), CD99 (anti-CD99; green), and nuclei (PI; red). UET-13TR-EWS/FLI1 cells were cultured as described for panel A and then stained as described in Materials and Methods. (C to E) Measurements of whole-cell size (C), nuclear size (D), and N/C ratio (E) in tetracycline-treated UET-13 transfectants. UET-13TR-EWS/FLI1 and UET-13TR-EWS/ERG cells were cultured on coverslips in the presence of tetracycline for 72 h and then stained as described in Materials and Methods. These samples were analyzed by the image analysis software Image J (n = 50). (C and D) Data are relative values with the SE and are normalized to the size of CD99− cells, which is arbitrarily set to 100. (E) Data are relative values with the SE and are normalized to the size of CD99− cells, which is arbitrarily set to 1.

