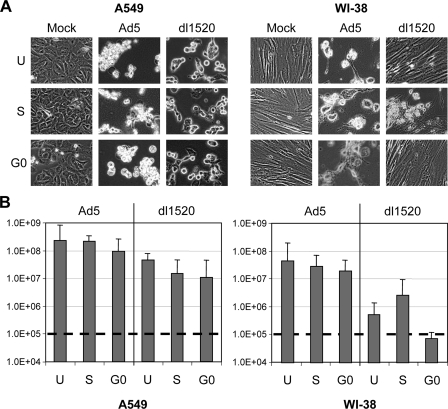
FIG. 6.
(A) Comparison of CPE in A549 and WI-38 cells infected with Ad5 and dl1520 at G0 or S phases. All microscopy is originally at a magnification of ×20 at 72 h postinfection. (B) Comparison of Ad5 and dl1520 replication in A549 and WI-38 cells. The dashed line indicates the level of virus added into the cell culture originally. The bars represent the means ± standard errors of the means obtained from triplicate determinations at 72 h postinfection. U, unsynchronized; S, S phase; G0, G0 phase.

