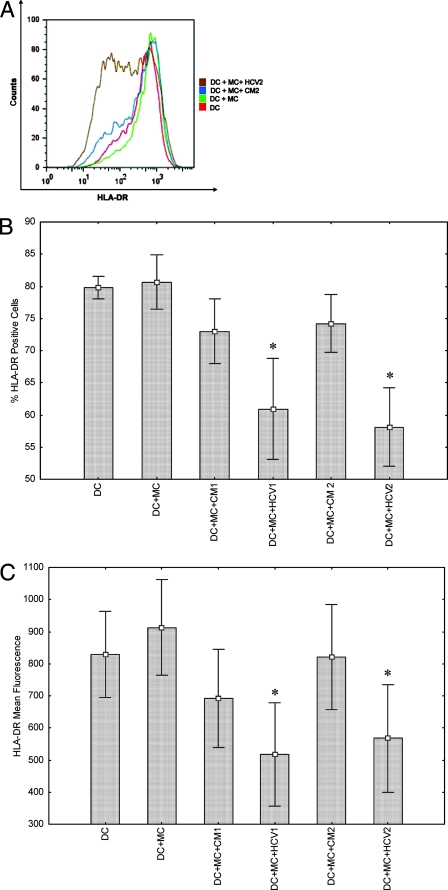
FIG. 4.
Expression of HLA-DR on cell surface upon exposure of human monocyte-derived DCs to HCV. FACS analysis and a typical expression profile of HLA-DR on the cell surface of monocyte-derived DCs from a healthy volunteer, and after stimulation with MC as a positive control are shown. (A) DCs were treated separately with conditioned medium (CM2) from hepatocytes as a mock control or exposed to cell culture-grown HCV2. (B and C) FACS analysis showing inhibition of HLA-DR expression on cell surface upon exposure of DCs from five healthy volunteers to cell culture-grown HCV genotype 1a or genotype 2a. Results are presented as percentages of positive cells (B) and mean fluorescence intensity (C). HLA-DR expression was analyzed using immature DCs, cells treated with MC, and cells treated with MC and CM from IHH (CM1) or Huh-7.5 (CM2) and HCVcc genotype 1a (HCV1) or genotype 2a (HCV2). *, P < 0.05 by Wilcoxon matched-pair test in comparison with DCs treated with MC alone.

