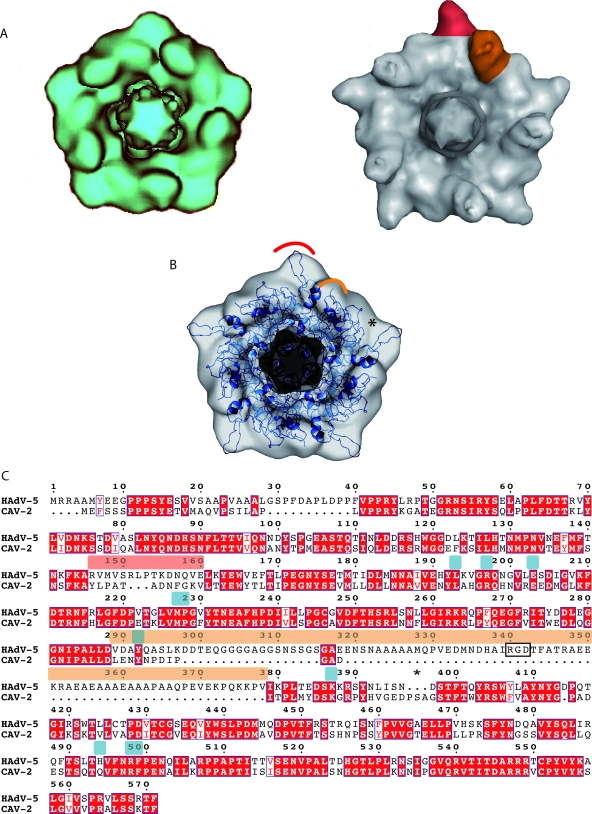
FIG. 2.
The CAV-2 penton base. (A) Comparison between the computationally isolated penton from the CAV-2 capsid in blue (left) and the hAdV-5 capsid in gray (right). One of the five hypervariable regions is highlighted in red, and one protuberance harboring the RGD sequence is shown in orange in the hAdV-5 penton. (B) Fitting of the hAdV-2 penton base X-ray structure in blue (PDB accession number 1X9T) into the 12-Å CAV-2 cryo-EM envelope. The red and orange parts correspond to the regions indicated in panel A. The star indicates a region where the X-ray structure did not fill the EM density. (C) Sequence alignment of the hAdV-5 and CAV-2 penton bases visualized with ESPript (23). The RGD and hypervariable loops are indicated by bars above the sequence in the same colors as used in panels A and B. The RGD sequence is boxed with a black rectangle. Conserved residues are in white text and highlighted in red; partially conserved residues are in red text. The star highlights three extra amino acids present in CAV-2 compared to hAdV-5 that could fill up the density indicated by the star in panel B. The amino acids involved in fiber binding for hAdV-5 are indicated by blue bars above the sequence.

