FIG. 3.
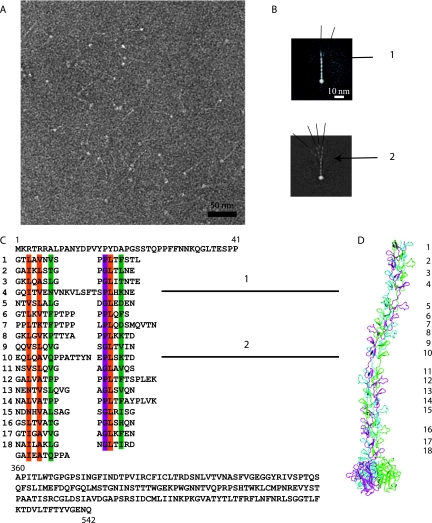
The CAV-2 fiber. (A) Electron micrograph of negatively stained CAV-2 fibers. The thin shafts and their globular knobs are clearly visible. Scale bar, 50 nm. (B) Averaged image of fibers selected from micrographs like that shown in panel A. The fiber is generally straight but can exhibit two kinks as indicated by the numbers 1 and 2. The different lines show the angle that the N-terminal part makes with the rest of the shaft. (C) Sequence of the CAV-2 fiber shaft showing the repeat motifs that correspond to the location of the bends. The top part of the sequence is the N-terminal tail of the fiber, and the lower part is the C-terminal knob. The repeat residues involved in the hydrophobic core are in orange, the ones forming the peripheral hydrophobic patches are in green, and the conserved glycine or proline residues are highlighted in purple according to van Raaij et al. (54). (D) Hypothetical model of the CAV-2 fiber showing the predicted bends at repeats 4 and 10. The repeats are indicated with the same numbers as in the sequence shown in panel C.

