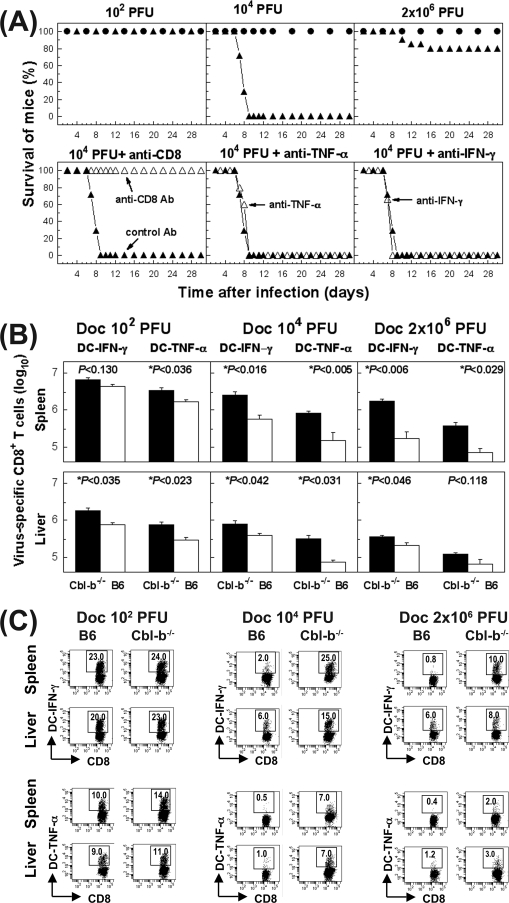
FIG. 8.
Dysregulated virus-specific CD8+ T-cell response in Cbl-b−/− mice causes lethal pathology. (A) The upper panels show results for B6 (•) or Cbl-b−/− (▴) mice infected with a low (102 PFU), moderate (104 PFU), or high (2 × 10⁶ PFU) dose of LCMV Docile; these animals were monitored for survival. Data represent a cohort of 10 mice for each mouse genotype for two experiments. The lower panels show results for Cbl-b−/− mice infected with 104 PFU of LCMV Docile; the mice were either depleted of CD8+ T cells by antibody (Ab) treatment on day 5.5 p.i. or injected with anti-TNF-α or anti-IFN-γ (Δ). For a control, mice were injected with isotype control antibody on days 4 and 6 p.i. (▴). Data represent a cohort of three to five mice for each group. (B) Kinetics of virus-specific CD8+ T-cell responses and their functional properties (IFN-γ and TNF-α production) in Cbl-b−/− and control B6 mice that were infected with different doses (102, 104, or 2 × 10⁶ PFU) of Docile (Doc). Total numbers of virus-specific CD8+ T cells on day 7 p.i. in the spleen or liver were determined by staining for IFN-γ (filled bars) or TNF-α (open bars) following stimulation with virus-infected DC2.4 cells (DC). Statistical significance is indicated by an asterisk and the P value indicated above the column. Data shown are mean ± SEM log10 virus-specific T cells per spleen for five mice. (C) Representative profile of virus-specific CD8+ T cells positive for IFN-γ or TNF-α in the spleen or liver on day 7 p.i. determined by intracellular staining following stimulation of cells with virus-infected DC2.4 cells (DC). The percentages of CD8+ T cells staining positive for IFN-γ or TNF-α are indicated in the upper corners of the corresponding panels.

