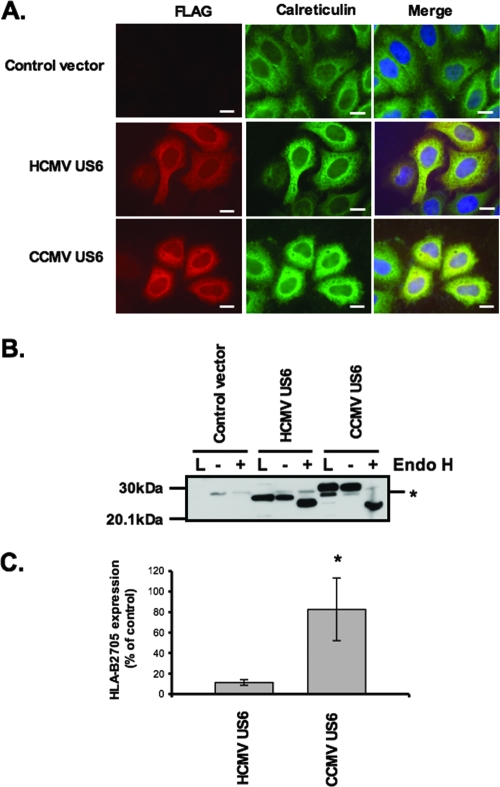
FIG. 6.
CCMV US6 localizes to the ER but does not inhibit cell surface HLA-B2705 expression. (A) Analysis of the intracellular localization of CCMV US6 by immunofluorescence microscopy. HeLa-M cells were transfected with either a control vector or with CCMV US6 or HCMV US6. The transfected cells were stained with an antibody specific for the ER marker calreticulin and the anti-FLAG epitope tag monoclonal antibody M2, which detects the US6 proteins. Calreticulin staining was detected with an anti-rabbit fluorescein isothiocyanate (FITC) antibody, and FLAG staining was detected with an anti-mouse Texas red antibody. Antibody fluorescence was visualized using a Zeiss Axioplan 2 microscope. The right panels are merged images of the red and green channels where yellow indicates colocalization; in these panels, the nuclei are also visualized with 4′,6′-diamidino-2-phenylindole (DAPI) (blue). Bars, 5 μm. (B) Endo H digestion of CCMV US6. HeLa-M cells were transfected with either a control vector, HCMV US6, or CCMV US6. Cell lysates (L) were immunoprecipitated with the anti-FLAG epitope antibody M2 and either digested with Endo H (+) or mock digested (−). Samples were resolved by SDS-PAGE, proteins transferred onto PVDF membranes and probed with the anti-FLAG epitope tag antibody M2. The position of a background band present in all samples that may correspond to the light chain of the M2 antibody is indicated by the asterisk. (C) Analysis of the effect of CCMV US6 on HLA-B2705 expression. HeLa-M cells were either transfected with the control vector or cotransfected with the control vector and the HLA-B2705 expression construct or cotransfected with HLA-B2705 and the US6 constructs. To detect HLA-B2705 cell surface expression, the transfectants were stained with the ME1 MAb and a Cy5-conjugated secondary antibody; antibody fluorescence was quantified by flow cytometry. The level of HLA-B2705 expression is expressed as a percentage of the MFV of the positive control (cells transfected with HLA-B2705 and control vector) after subtracting the MFV of the negative control (cells transfected with control vector only). Each bar represents the mean level of HLA-B2705 expression calculated from four independent experiments. Error bars show the standard deviations. Statistical analysis was performed using the Mann-Whitney U test. The sample with a significantly increased level (P ≤ 0.05) of cell surface HLA-B2705 expression compared to that of cells cotransfected with the HCMV US6 and HLA-B2705 vectors is indicated with an asterisk.

